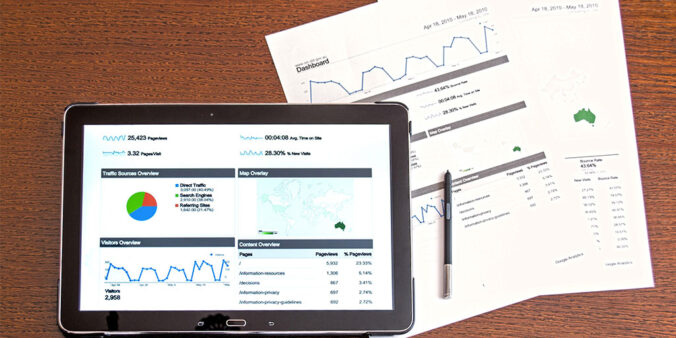
Web analytics defines the collection and analysis of user data from a website.
From when a user lands on a website, data and user activity is being collected. Understanding the basics of analytics provides insights into how a website is performing.
So how does analytics work?
Analytics are tracked by inserting a snippet of code into the background of a website. It tracks and analyses a user’s behaviour.
A piece of data called a ‘cookie’ remains in the browser allowing analytics to track if a user returns. Information may be restricted if a user deletes cookies, or hides their browsing activity e.g. Virtual Private Network (VPN).
Defining website objectives
When considering analytics it’s important to understand the objectives set for your site. SMART goals (specific, measurable, achievable, realistic, timely) provide a basis when defining performance.
Consider the following questions:
- What is the purpose?
- Who is the audience?
- What do you want users to do?
- What does success mean? How can we measure this?
This information establishes what information is a key indicator of defining success. You should nominate which data can indicate whether your website objectives are being met.
Numbers that matter
Analytics has several data streams to gain a better understanding of visitor experience. Understanding the basics of analytics and identifying key measures help you define your success and areas for improvement.
Time measurement
Time is important when defining user goals and objectives. Time helps understand the performance in comparison to a previous week month or year.
A term such as week on week (WoW) defines the traffic in the immediately preceding week. This is also used for monthly (MoM) and yearly (YoY) reporting.
This defining period can show if updates have changed user behaviour. This may also reveal if external factors are changing behaviour.
Frequently asked questions with analytics
The following questions can be answered through analytics.
What are the top-ranked pages on my site? How many visitors do I have?
Pageviews is a simple quantitative statistic to determine how many times a page has been viewed. Ranking this data can determine which pages users are most engaging with. Drilling down further, analytics records individual sessions. Unique visitor can reveal how many users are returning to your website.
Where is my traffic coming from?
Analytics can provide an approximate location based on the user’s IP address. This helps when you are targeting a specific geographic location.
What digital channel has the user arrived from?
This helps determine if paid media is working and shows which sources the user is coming from. This data determines if email links or social media traffic is leading visits. An understanding of this data can shift the focus of a website marketing strategy.
How long visitors are spending on my site?
The time users are engaging with a website determines if users are reading or scanning. This may also reveal a problem with users getting stuck on a page.
As every page is different there is no industry standard for time spent on a page. However, tools such as the Hemingway app provide guidance on estimated reading time.
What device or browsers are my visitors using?
Knowing the technology visitors use provides insights on how to display content. Information such as device type (e.g. desktop, mobile) and browser is available in analytics. This information informs web and UX designers to provide content that fits the needs of a user.
On which pages are visitors landing? Do users leave before viewing other pages? Where are users leaving my site?
A user journey can be tracked from entry to exit. We can understand if users are taking the desired actions or conversions.
A bounce rate defines a user landing on a website but leaving before viewing any other page. A low bounce rate (<20%) means users are finding what they are looking for, leading further within a website.
Understanding where a user is leaving can reveal potential pain points or issues. An exit rate will also reveal the percentage of users exiting relative to the number of visits on a page.
Learn more
Want to learn more about Analytics? View a list of terms.
Analytics has been set up for the La Trobe University website. To receive a report on how your site is performing, please log a Marketing Request.
Have questions about your web editing?
Remember, we’re always here to help! To reach out, please:


