Adobe Analytics data is now flowing to Siteimprove, providing access to simple metrics of your website.
What is it?
Adobe Analytics is our chosen analytics provider. This helps us to explore and optimise digital experiences.
Thanks to Siteimprove’s integration, we’re making data available in the platform. Siteimprove will display data from the past 30 days (rolling period).
How can it help?
When you can’t get to all quality assurance issues at once, analytics can provide insights into the impact of an issue. Analytics will be available on Siteimprove dashboards to help us filter, sort and focus on critical issues.
Information available in Siteimprove:
- page views
- clicks on broken links
- clicks on broken documents.
Where does this data appear?
Broken links
The ‘Broken links’ dashboard will provide a list of all broken links and include a ‘clicks’ column. This provides a cumulative total (important if the broken link appears on many pages) of all link clicks.
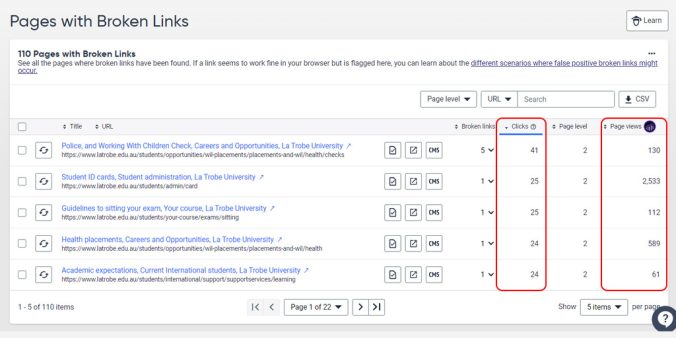
Pages with Broken links
The ‘Pages with broken links’ dashboard includes a ‘clicks’ column to show how many attempts a link has been opened. As well as a ‘page views’ column to display the total views for the page.
General link and page views
Data is available on all pages crawled by Siteimprove, not just pages with issues.
Visit the ‘Pages’ tab under Quality Assurance > Inventory, to find page view statistics for your site section.
Have questions about your web editing?
Remember, we’re always here to help! To reach out, please: